
High Desert Market is Resource Rich for Builders


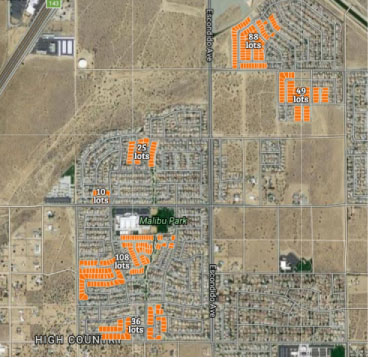
Mimi Song Companyhas recently completed a review of the finished lot supply in the High Desert. Using our in-house GIS system we did a rough accounting of finished lots on a project basis, and then also aggregated by city. To visualize the supply of finished lots see the map that we’ve built here.
Some takeaways:
Overall the market has about 4,800 lots. To count a finished lot we used a rough definition of a recorded lot that fronts on a paved street. That may have led to some minor over-counting, but it got us in the ballpark without having to visually inspect every lot.
To put those 4,800 lots in perspective, from the years 2004 to 2006 the market never fell below 5,300 building permits (SFR) in any year.
However, there are also negative ways to look at the 4,800 lots. For instance, based on average absorption from 2010 to 2015, the City of Victorville has a 27 year supply. That’s if velocities stay the same and don’t change at all.
Below is a table that breaks down the supply of lots by city, using a few different absorption rates. Note that long term refers to 1990-2015.
| Location | Long Term Median | Average Since 2010 | Long Term Average | Peak |
| City | Yearly Absorption / Years of Supply | Yearly Absorption / Years of Supply | Yearly Absorption / Years of Supply | Yearly Absorption / Years of Supply |
| ADELANTO | 134 / 3.4 | 51 / 8.8 | 262 / 1.7 | 1101 / 0.4 |
| APPLE VALLEY | 224 / 2 | 81 / 5.6 | 337 / 1.3 | 1349 / 0.3 |
| HESPERIA | 214 / 3.5 | 33 / 23.1 | 396 / 1.9 | 1760 / 0.4 |
| VICTORVILLE | 359 / 8.8 | 117 / 27 | 750 / 4.2 | 3016 / 1 |
The way to read the table is that Hesperia’s long term median building permits per year is 214 permits. At that rate the City currently has a 3.5 year supply. The city’s long term average (mean) is 396 permits, which would be just a 1.9 year supply. Based on the city’s peak permits of 1,760, which happened in 2005, there would be just a half year of supply.
Looking at supply through a few different lenses probably makes some sense. You could think of it as a simple sensitivity analysis.
The High Desert market is resource rich for builders because it’s one of the last places in California where lots can be purchased below replacement cost. Further, new projects face almost no competition from public builders and very low levels of competition in general.
An often overlooked dynamic of the market is the way that both success and failure create cascading effects. More local building leads to more jobs, which leads to more people available to purchase homes, which leads to higher prices, which leads to more building, and so on. The same phenomena happens in reverse on the way down.
So a market where construction has been scarce, and lots can be purchased at a discount to replacement value, might just be getting started. It hasn’t experienced positive cascading effects yet.
Next week we expect to close a 53 lot finished deal, but we are still marketing 18 adjoining recorded lots. For information on the 18 lots, or various potential finished lot opportunities, contact John Reeder at 909-989-8590, or email to reeder@mimisongcompany.com.
*It might be appropriate to knock 3% off the total number of finished lots as our data source used to compile this analysis could be trailing the market in terms of construction. That would put the total supply in the 4,650 range. However, that probably doesn’t matter much as the supply is entirely sensitive to building activity. It doesn’t matter whether we have 4,000 or 4,600 lots. At least not as much as it matters whether we absorb 500 units per year, or 1,000 units per year.

